Virtual Machine Dashboard
The dashboard displays information about the performance and resource usage of your virtual machine, as well as THE available resource pool according to your subscription.
1. PERFORMANCE SCHEDULE
The dashboard displays a chart with key virtual machine performance metrics. By default, the performance metrics displayed in the chart include the percentage of CPU usage time, memory, storage and network bandwidth.
You can adjust the unloading state of your virtual machine by selecting the corresponding option from the drop-down list in the upper right corner of the page:
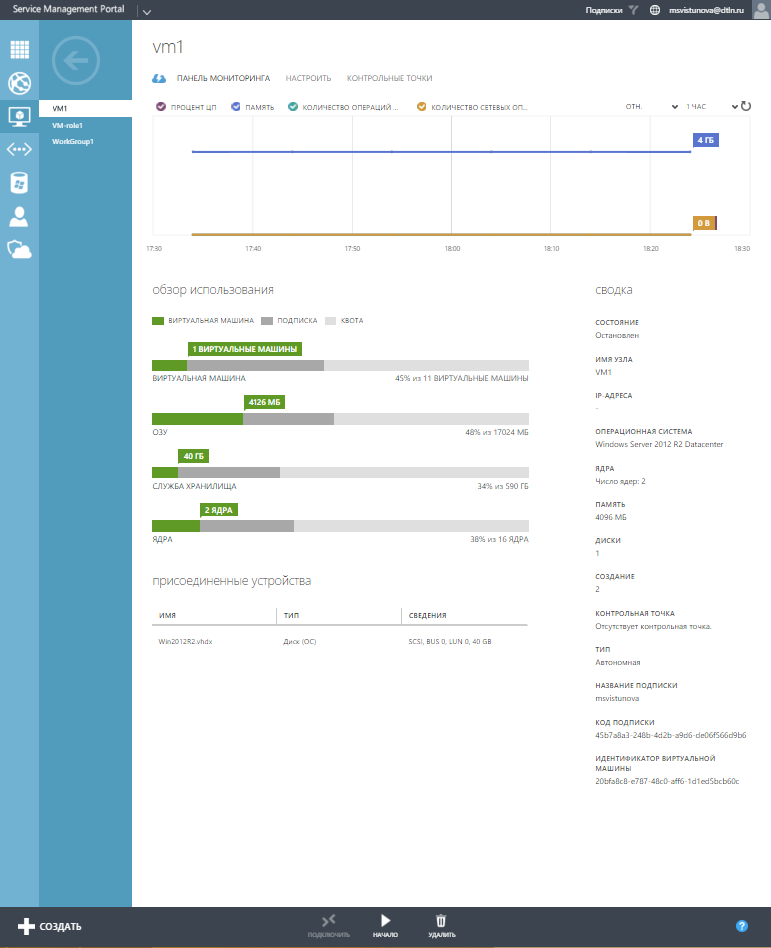
- by percentage of CPU, memory, number of network operations, the number of operations for storage by or unchecking the box.
- by values – absolute / relative
- by time period – day, month, year
2. USAGE REVIEW
The dashboard also displays a USAGE REVIEW, showing the resources used by the virtual machine, and their relation to the maximum possible for the subscription.
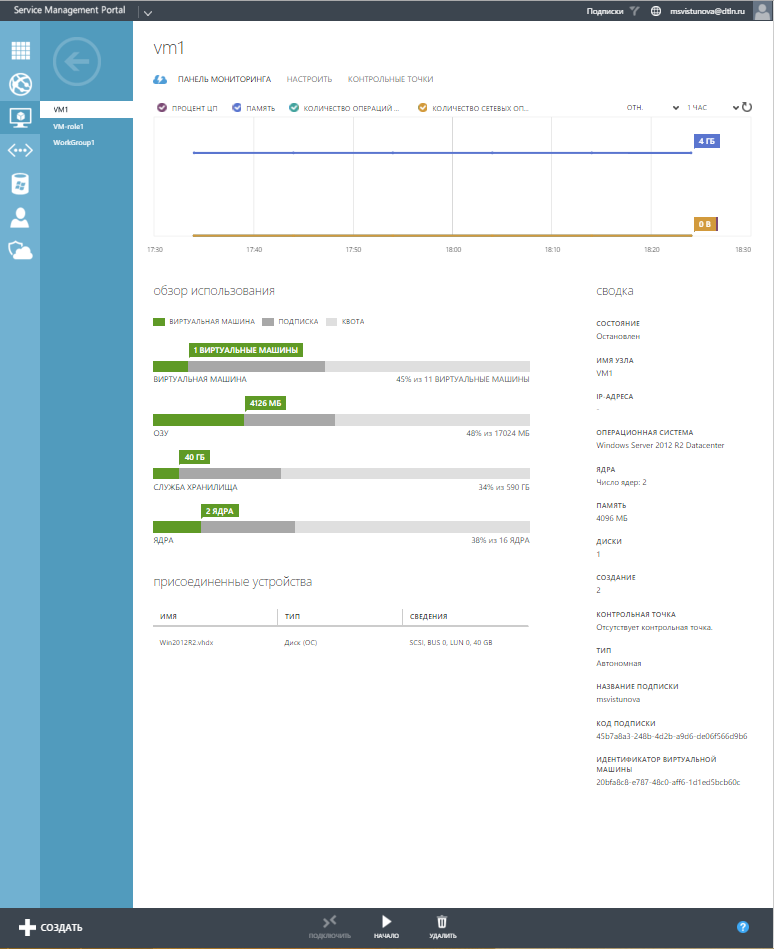
- by resources employed by the virtual machine
- by resources available on the subscription
- by available resource quota on the account
3. CONNECTED DEVICES
Networks and devices connected to the VM.

4. SUMMARY
The Summary section displays other virtual machine parameters: its status, the name of the virtual machine server, the associated IP-addresses, the OS installed on it, the number of cores, the number of drives connected to it and the subscription plan in which the virtual machine was created.